
Exercises
1. Classify the following as motion along a straight line, circular or oscillatory motion:
(i) Motion of your hands while running.
(ii) Motion of a horse pulling a cart on a straight road.
(iii) Motion of a child in a merry-go-round.
(iv) Motion of a child on a see-saw.
(v) Motion of the hammer of an electric bell.
(vi) Motion of a train on a straight bridge.
Answer
(i) Oscillatory motion
(ii) Straight line motion
(iii) Circular motion
(iv) Oscillatory motion
(v) Oscillatory motion
(vi) Straight line motion
2. Which of the following are not correct?
(i) The basic unit of time is second.
(ii) Every object moves with a constant speed.
(iii) Distances between two cities are measured in kilometres.
(iv) The time period of a given pendulum is not constant.
(v) The speed of a train is expressed in m/h.
Answer.
(i) Correct
(ii) Not correct
(iii) Correct
(iv) Not correct
(v) Not correct
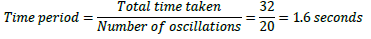
3. A simple pendulum takes 32 s to complete 20 oscillations. What is the time period of the pendulum?
Answer
Numbers of oscillations = 20
Time taken = 32 sec
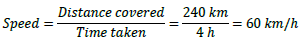
4. The distance between two stations is 240 km. A train takes 4 hours to cover this distance. Calculate the speed of the train.
Answer.
Distance between two stations = 240 km
Time taken = 4 hrs
5. The odometer of a car reads 57321.0 km when the clock shows the time 08:30 AM. What is the distance moved by the car, if at 08:50 AM, the odometer reading has changed to 57336.0 km? Calculate the speed of the car in km/min during this time. Express the speed in km/h also.
Answer.
Initial reading of odometer = 57321.0 km
Final reading of odometer = 57336.0 km
Initial Time = 8:30 AM
Final Time = 8:50 AM
Total distance covered = Final reading of odometer – Initial reading of odometer
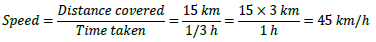
=57336.0 – 57321.0 = 15.0 km
Total time taken = Final Time – Initial Time = 8:50 AM – 8:30 AM = 20 minutes
20 minutes = 20/60 hrs = 1/3 hrs
6. Salma takes 15 minutes from her house to reach her school on a bicycle. If the bicycle has a speed of 2 m/s, calculate the distance between her house and the school.
Answer
Speed of bicycle = 2 m/s
Time taken = 15 mins = 15 × 60 secs = 900 secs
⇒ Distance = Speed × Time = 2 × 900 metres = 1800 metres = 1.8 km
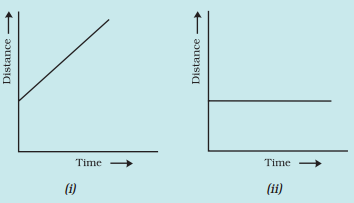
7. Show the shape of the distance-time graph for the motion in the following cases:
(i) A car moving with a constant speed.
(ii) A car parked on a side road.
Answer
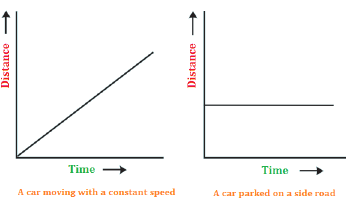
(i) The graph will be a straight line passing through the origin.
(ii) The graph is a straight line parallel to x-axis or time axis.
8. Which of the following relations is correct?
(i) Speed = Distance × Time (ii) Speed = Distance/Time
(iii) Speed = Time/Distance (iv) Speed = 1/Distance × Time
Answer
(ii) Speed = Distance/Time
9. The basic unit of speed is:
(i) km/min (ii) m/min
(iii) km/h (iv) m/s
Answer
(iv) m/s
10. A car moves with a speed of 40 km/h for 15 minutes and then with a speed of 60 km/h for the next 15 minutes. The total distance covered by the car is:
(i) 100 km (ii) 25 km
(iii) 15 km (iv) 10 km
Answer
(ii) 25 km
Firstly, the car is moving with 40km/h for 15 minutes.
15 minutes = 15/60 hrs = 1/4 hrs
Distance covered,
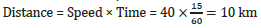
Secondly, the car is moving with 60km/h for 15 minutes.
Distance covered,
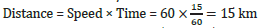
Total distance covered = 10 km + 15 km = 25 km
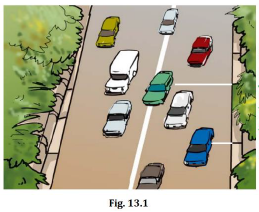
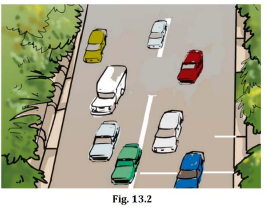
11. Suppose the two photographs, shown in Fig. 13.1 and Fig. 13.2, had been taken at an interval of 10 seconds. If a distance of 100 metres is shown by 1 cm in these photographs, calculate the speed of the blue car.
Answer.
First, measure the distance with the help of scale and then proceed as given below.
Suppose the distance measured by scale is 2cm.
Multiply 2 with 100 to get the actual distance = 2 × 100 = 200 m. (1cm = 100m)
Interval time between the photos taken = 10 s.
Speed of the blue car = 200/10 m/s = 20 m/s
12. Fig. 13.15 shows the distance-time graph for the motion of two vehicles A and B. Which one of them is moving faster?
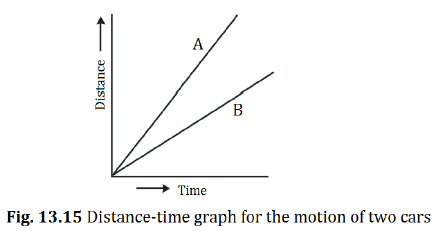
Answer. Vehicle A is moving faster because it has more slope than vehicle B. In distance-time graph, speed is measured by its slope.
13. Which of the following distance-time graphs shows a truck moving with speed which is not constant?
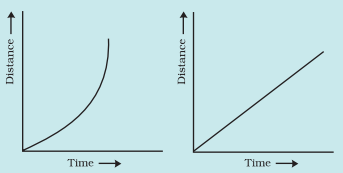
(iii) (iv)
Answer
Option (iii) because the slope of the graph is not a straight line and hence it does not show a uniform motion.